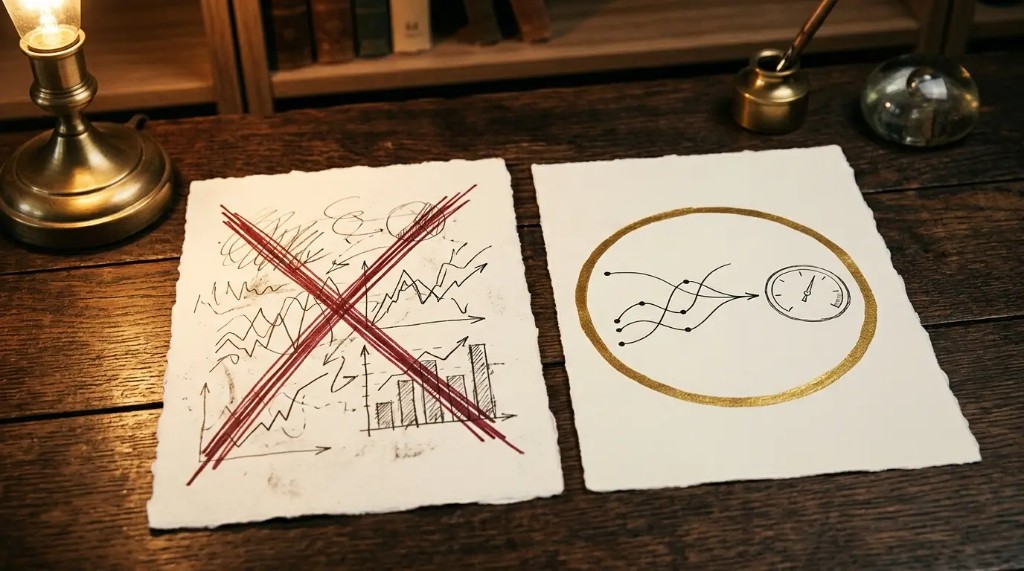
A dashboard's greatest danger is not that it fails to work, it is that it works perfectly while showing numbers that are wrong, because a broken dashboard gets noticed and fixed while a lying one gets believed and acted on. This chapter is about keeping dashboards honest: the data quality that determines whether they tell the truth, the definitions discipline that keeps numbers meaningful, and who gets to see what. It is short, and it matters more than any chapter about building views, because everything built on bad data is worse than nothing.
Garbage in, gospel out
The oldest rule in data is garbage in, garbage out, and dashboards add a cruel twist to it: garbage in, gospel out, because a dashboard takes messy, incomplete, or wrong data and presents it as clean, authoritative numbers on a professional-looking screen, which people then trust and act on precisely because it looks trustworthy. A dashboard does not just fail to help when the data is bad, it actively misleads, dressing up wrong numbers in a form that invites confidence, and the better the dashboard looks, the more convincingly it lies.
This is why data quality is the foundation of everything in this book, and it connects straight back to the disciplines the other systems built. Dashboards pull from the CRM, so if the CRM is full of duplicates and half-filled records, the CRM book's data hygiene neglected, the dashboard's numbers are wrong, confidently. They pull from the systems the automation book wired, so if a connection has silently broken, the automation book's silent-failure problem, the dashboard shows numbers frozen at whenever it broke, looking current and being stale. The dashboard is only ever as honest as the data feeding it, which means keeping dashboards trustworthy is mostly about keeping the underlying systems clean, and a business that wants to see clearly has to care about the quality of its data at the source, not just the polish of the view. The view cannot fix bad data, it can only display it beautifully.
MESSY DATA IN
Duplicates, gaps, a broken feed.
CLEAN, AUTHORITATIVE NUMBERS OUT
It does not just fail, it dresses wrong numbers in a form that invites confidence.
The better the dashboard looks, the more convincingly it lies.
Definitions, held over time
Chapter two made shared definitions the foundation of trustworthy numbers, and keeping dashboards honest means holding those definitions over time, because definitions drift. Someone starts counting leads slightly differently, a new system defines a sale its own way, a well-meaning change to how something is recorded quietly breaks the comparison with everything before it, and suddenly the trend on the dashboard is not comparing like with like, so it lies without anyone intending it to. The discipline is to keep the definitions written down, shared, and stable, and when a definition genuinely must change, to change it deliberately and knowingly rather than letting it drift, understanding that it breaks comparison with the past. A dashboard's numbers are only meaningful if they mean the same thing over time, and holding the definitions steady is what keeps a trend an honest trend rather than an artefact of a definition that quietly moved.
Who sees what
The last honesty question is about access: who should see which numbers, because not everything should be visible to everyone. Revenue, margin, and the financial health of the business are often the owner's to see and not the whole team's, while a salesperson might see their own pipeline but not the company's full financials, and the appropriate visibility varies by business and by role. This is not about secrecy for its own sake, it is about the right people seeing the right numbers, the ones relevant to their work and their decisions, without either overwhelming people with numbers that are not theirs to act on or exposing sensitive financials more widely than intended. A dashboard system should let the right people see the right views, and part of setting it up well is deciding, deliberately, who sees what, so that everyone has the numbers they need for their role and the sensitive numbers stay with those who should have them. Privacy and appropriate access are part of honesty too, because a dashboard system that leaks sensitive numbers or buries people in irrelevant ones is not serving anyone well.
OWNER
Revenue, margin, full financials.
SALESPERSON
Their own pipeline, not the full financials.
EACH ROLE
The numbers relevant to their decisions.
The right people, the right numbers, deliberately decided.
It is worth being honest about the quietest and most dangerous failure a dashboard can have, because it is the one that does the most damage and gives the least warning: the dashboard that lies while looking perfectly fine.
The real picture
A dashboard pulls its numbers from your systems through connections, the same wiring this series' automation book described, and those connections can break silently, exactly as that book warned. A sync stops. A tool changes something. A connection quietly fails. And here is the cruel part: the dashboard does not go blank or show an error, it keeps displaying the last numbers it received, which look completely normal, so the business glances at it, sees numbers that seem fine, and carries on, not knowing that those numbers froze last Tuesday and reality has moved on without them. The dashboard is confidently showing the past while looking like the present, and everyone trusts it because it looks exactly as it always does. A business can make decisions for weeks on frozen numbers, thinking it is seeing clearly, when in fact it went blind quietly and nothing told it.
This is the same silent-failure danger from the automation book, and it matters even more here, because a dashboard's entire purpose is to be trusted, so a dashboard that fails silently betrays the exact trust it was built to earn. The defence is the same discipline that book prescribed: monitoring the pipes, not just admiring the view. The connections that feed the dashboard have to be watched, so that if one stops flowing, someone is told, rather than the stale number sitting there looking healthy. A well-built dashboard system watches its own data flows and raises a flag when something stops updating, so silence is caught rather than mistaken for calm. A dashboard nobody is monitoring is a dashboard that will, someday, quietly freeze and keep smiling, and the business will act on a photograph of the past believing it is a window on the present.
There is a second, subtler version of the same danger, and it is the definitions drifting from chapter two happening invisibly over time. The dashboard keeps working, the numbers keep displaying, but somewhere underneath, what a lead means or how a sale is counted quietly changed, so the trend the dashboard shows is comparing this month's new definition against last month's old one, and it looks like a real movement when it is actually an artefact of a definition that moved. This lies just as convincingly as frozen data, and it is even harder to spot, because nothing broke, the meaning just shifted. The defence is the definitions discipline held with real seriousness: written down, watched, and changed only deliberately, because a dashboard built on definitions that drift is measuring a moving target and calling the movement a result.
None of this is here to make you distrust dashboards, it is here to make you build and run them properly, on the understanding that a dashboard's authority is exactly what makes its errors dangerous, and that the price of being able to trust a dashboard is the discipline of keeping the data behind it honest, the connections watched, and the definitions steady. A dashboard you can trust is worth enormous amounts. A dashboard you trust that you should not is worse than no dashboard at all, and the only thing separating the two is the unglamorous work of keeping it honest.
THE DASHBOARD
Normal-looking numbers. These numbers froze last Tuesday, reality moved on.
PIPE MONITOR
Watching the connection. Raises a flag when flow stops.
It fails silently and keeps smiling. Monitor the pipes, not just the view.
In short
Keeping dashboards honest is mostly about the data behind them: clean at the source, defined consistently, watched for silent failure, and shown to the right people. It is unglamorous, and it is what separates a dashboard you can trust from one that confidently misleads, which is the entire difference between a tool that helps you steer and one that drives you off the road while smiling. With the dashboards honest, the next chapter is about seeing further, being told when something needs attention rather than having to watch, and asking your business questions in plain language.