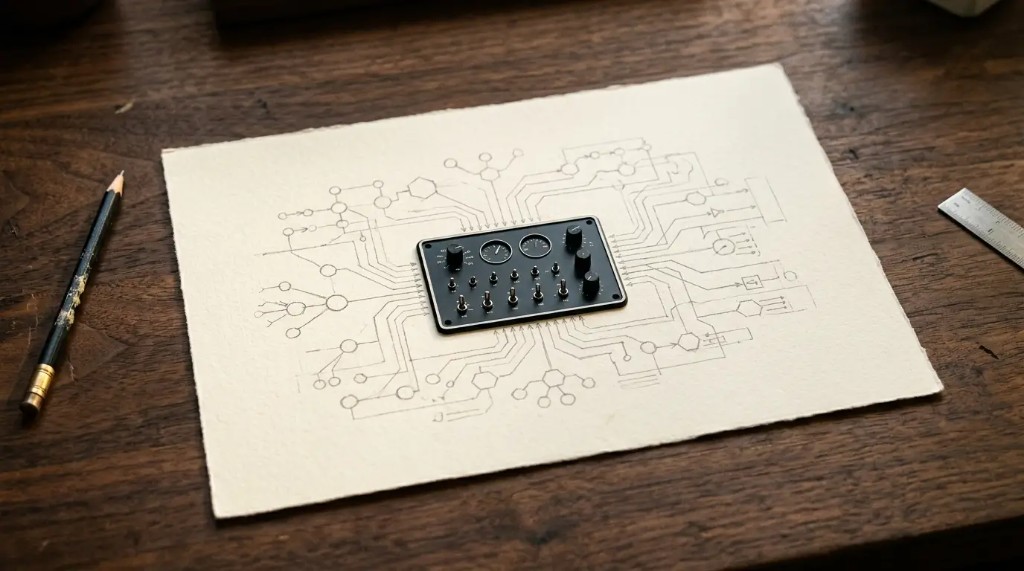
Every book in this series has had a chapter where the thing becomes part of one connected whole, and this is that chapter for dashboards, and for the series, because the dashboard is where the entire connected business finally becomes visible on a single screen. Everything the other books built, the website capturing, the CRM remembering, the automations moving information, the content earning attention, the trained team running it all, has been producing data, and the dashboard is where that data becomes sight. This chapter is the whole machine, seen at last as one thing, which is the note the series has been building toward from its first page.
Where the whole machine becomes visible
Picture what this series has built. The website senses, capturing enquiries and behaviour. The CRM remembers, holding every lead and deal and outcome. The automations act, moving information between systems the instant it is needed. The content earns attention on rented ground and carries it home. The accounting keeps the score. And all of it, every system, has been generating data as it runs. The dashboard is the screen where all of that becomes one visible picture, the single place the connected business can be seen whole, which is something none of the individual systems could show on its own.
This is why the dashboard is the natural last piece of the series. Each system this series built made the business run better in its own area, and each produced data as a byproduct, and until now that data lived scattered in each system, showing only its own slice. The dashboard connects into all of them and pulls the picture together, so that for the first time the owner can see, in one place, how the whole connected business is actually doing, not the website's view or the CRM's view or the accounting's view, but the business's view, assembled from all of them. The nervous system this series built now has a screen, and that screen is where seeing clearly finally becomes seeing everything.
WEBSITE SENSES
CRM REMEMBERS
AUTOMATIONS ACT
CONTENT EARNS
ACCOUNTING SCORES
TEAM DELIVERS
THE NERVOUS SYSTEM
The nervous system this series built, now with a screen.
The last piece, because it needs all the others.
One enquiry, and the whole loop, one last time
This series has followed a single enquiry through its systems more than once, and it is worth following it one final time, because the dashboard is where the loop closes and becomes visible. An enquiry arrives on the website. It becomes a tagged lead in the CRM. The automation acknowledges it and alerts the owner, and the content that earned it is credited with the source. The lead is worked, quoted, and won, and the moment it is won, the accounting raises the invoice and the onboarding begins, and the team, trained by the system this series built, delivers the work. And every step of that journey, the enquiry, the lead, the source, the conversion, the revenue, the delivery, produced data, and all of it flows to the dashboard, where it becomes numbers the owner can see: leads by source, conversion rate, pipeline, revenue, margin, all of it assembled from the journey of every enquiry through the whole connected system.
So the dashboard does not just show numbers, it shows the machine working. The leads-by-source number is the website and the content doing their job. The conversion number is the CRM and the follow-up doing theirs. The revenue and margin are the whole thing turning attention into business. The dashboard is the machine made visible, and watching it is watching the entire series' work run, in numbers, in one place, which is why it is the last chapter, because you cannot see the whole machine until every part of it is built and connected and feeding the screen.
ARRIVES
TAGGED LEAD
ACKNOWLEDGED
WORKED
WON
INVOICED
DELIVERED
THE DASHBOARD ABOVE
Leads by source, conversion, pipeline, revenue, margin. Each step emitting a number.
The dashboard does not just show numbers. It shows the machine working.
It is worth being honest about the engineering that makes a single-screen view of the whole business actually work, because "just connect everything to a dashboard" is a sentence that hides real complexity, and this is the same plumbing this whole series has described, gathered into one place.
The real picture
A dashboard that shows the whole business has to pull data from every system in it, and every one of those connections is a pipe that has to be built and maintained, the same pipes the automation book described, with all the same challenges. The systems each hold data in their own way, and getting it out and into a common view means connecting to each, on a schedule, reliably, and every connection can break, quietly, the silent failure this series keeps returning to, which for a dashboard means a frozen number that looks live. The systems count things on their own schedules, so pulling them together means deciding how often to refresh each and accepting that a single-screen view is only as current as its least-frequently-updated pipe, which is fine if you know it and misleading if you do not.
Then there is the reconciling, which is where the definitions discipline from chapter two meets the engineering. Different systems count differently, the website's idea of a visitor, the CRM's idea of a lead, the accounting's idea of revenue, and pulling them onto one screen means reconciling those counts so the numbers actually mean something together, which is real work, not a toggle. Two systems that both track sales may count them differently enough that adding them is meaningless, and the engineering of an honest dashboard includes resolving those differences so the combined number is true, which is exactly the reconciliation the e-commerce book described, applied across the whole business.
And underneath it all sits the same discipline every system in this series rests on: the connections carry credentials that must be stored and governed, the flows must be monitored so silent failure is caught, and the whole thing must be built to be maintained rather than assembled once and left, because a dashboard connected to a dozen systems is connected to a dozen things that will each change over time, and a change in any one can break the pipe feeding the screen. This is why a dashboard that genuinely shows the whole business is not a thing you buy and switch on, it is a system engineered and maintained like every other in this series, and the reason it can be built affordably now, the shift this series keeps describing, does not make the engineering disappear, it just makes it achievable. The single honest screen is real, and it is the product of the same careful, unglamorous work as everything else this series has built, which is the whole point: seeing clearly, like everything else, is a system, and systems are built and maintained, not conjured.
None of this is here to discourage you, it is here to be straight about what the single screen actually is, so that you value it correctly and build it properly. A dashboard that shows the whole connected business truthfully is one of the most valuable things an owner can have, and it is valuable precisely because it is not trivial to build, because it rests on every system being connected, every definition being shared, every pipe being watched, and every number being reconciled, which is the work of the whole series come together. When it is built right, the reward is the thing this series set out to deliver from its first page: a business you can actually see, and therefore actually steer.
THE SINGLE SCREEN
One dashboard fed by pipes from a dozen systems.
RELIABLE CONNECTION
REFRESH SCHEDULE
SILENT FAILURE MONITOR
RECONCILED COUNTS
GOVERNED CREDENTIALS
Seeing clearly, like everything else, is a system, built and maintained, not conjured.
In short
The dashboard is where the series ends because it is where everything the series built becomes visible: the connected business, on one honest screen, where the machine can be seen working and the owner can finally see clearly and steer on evidence. It is the last piece because it needs all the others, and it is the payoff of building them, because a business with all these systems and no way to see them whole is a powerful machine with no instruments, while a business that can see the whole thing on one screen can run itself with a clarity that flying blind never allowed. The remaining chapters are the toolkit of prompts and the close. The machine is built, connected, and now visible. The last thing is to keep seeing clearly as the business grows.